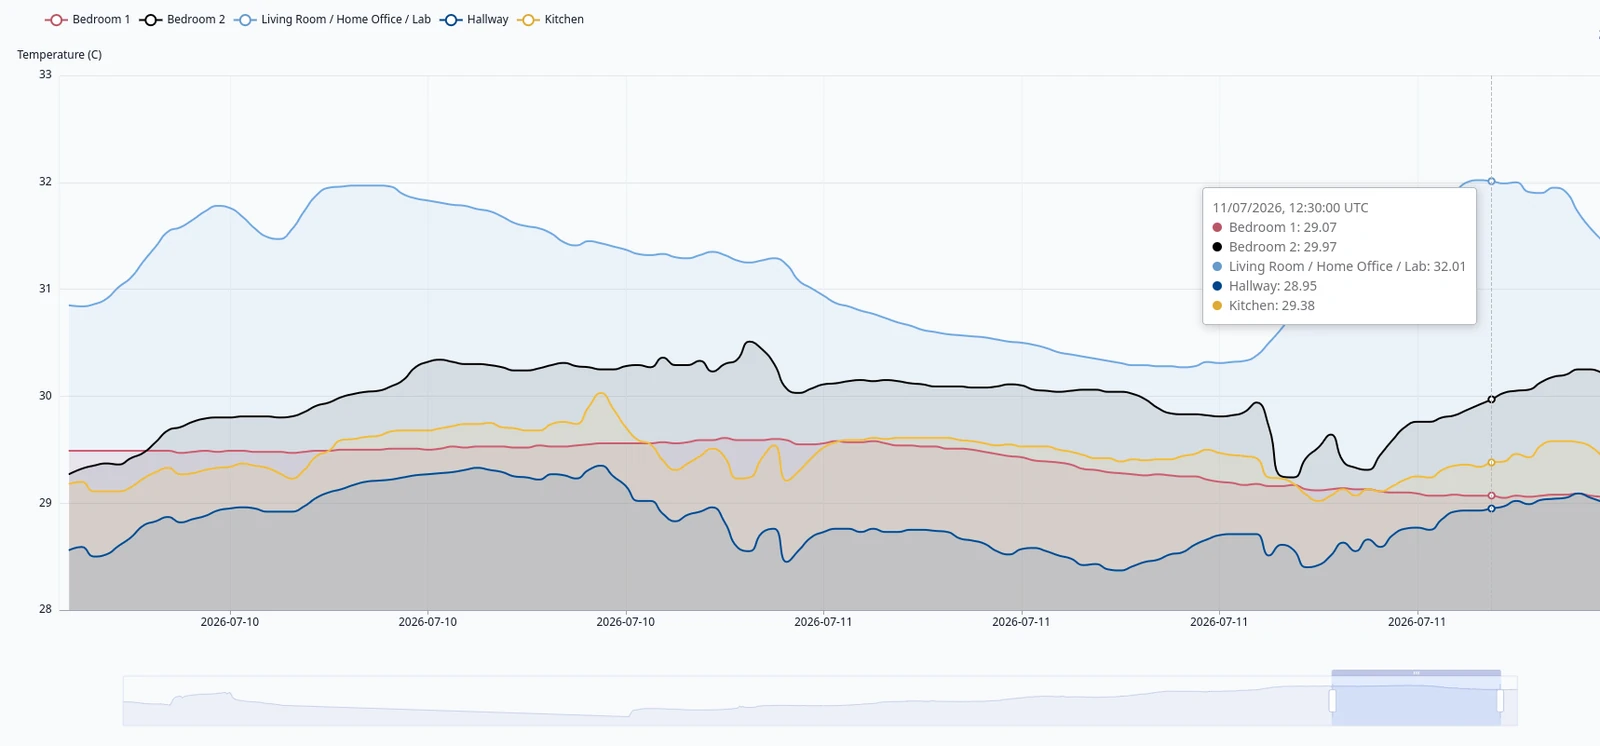
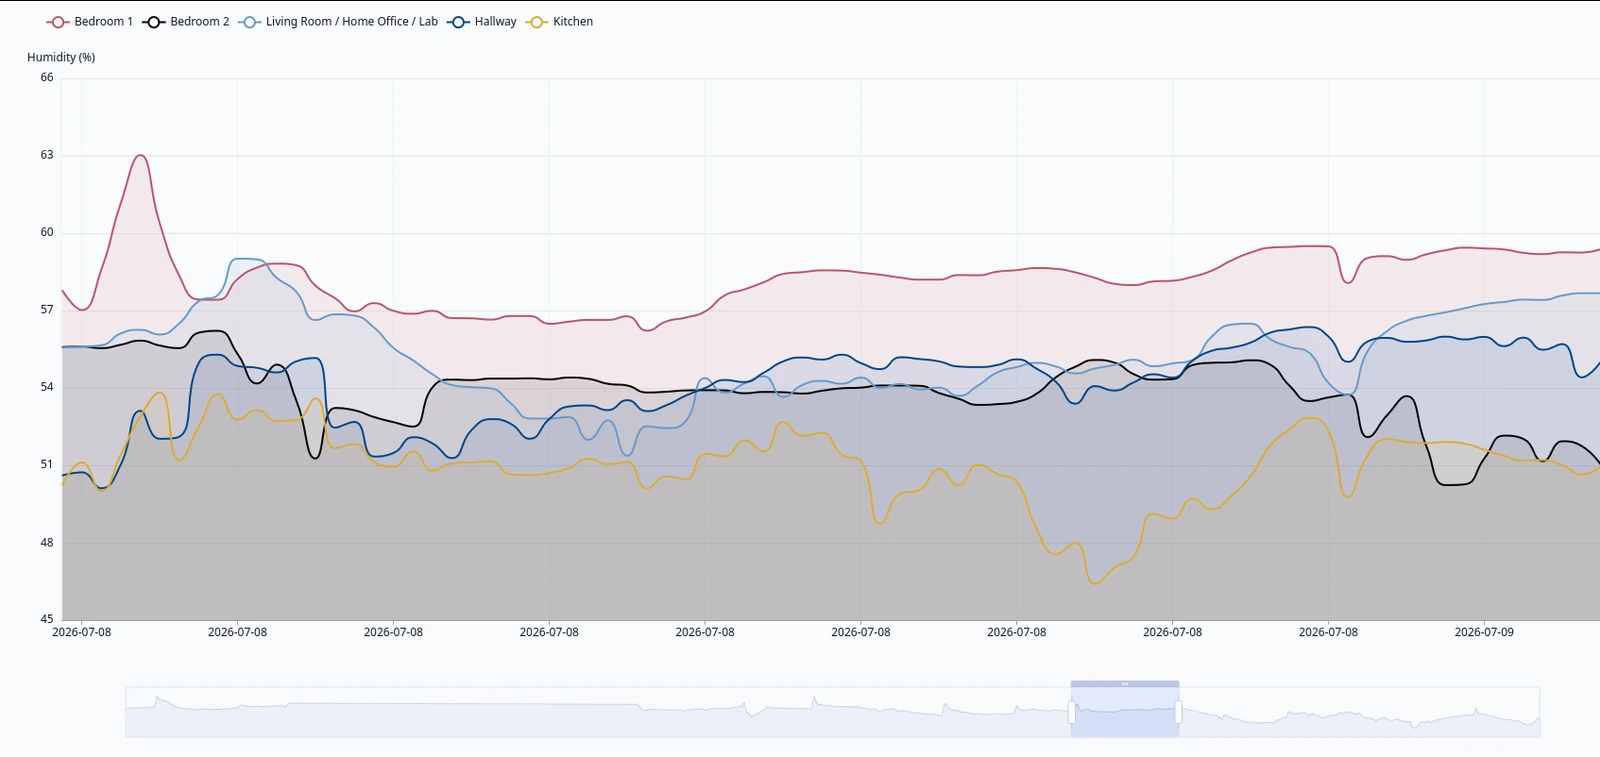
Indoor temperature and humidity monitoring makes it easier to compare conditions between rooms and observe how they change over time. This project uses compact sensor units with both wired LAN and Wi-Fi connectivity. Each unit uses a different RP2040-based microcontroller.
The electronics are housed in custom PETG enclosures, but the sensor itself must remain separate. It cannot be placed inside the electronics enclosure or near its ventilation openings, where rising warm air could pass over it and distort the readings. This is particularly important for the Wi-Fi module, which generates a considerable amount of heat. The final arrangement was validated against a reference sensor after previous enclosure designs failed the test.
Printing the Enclosures
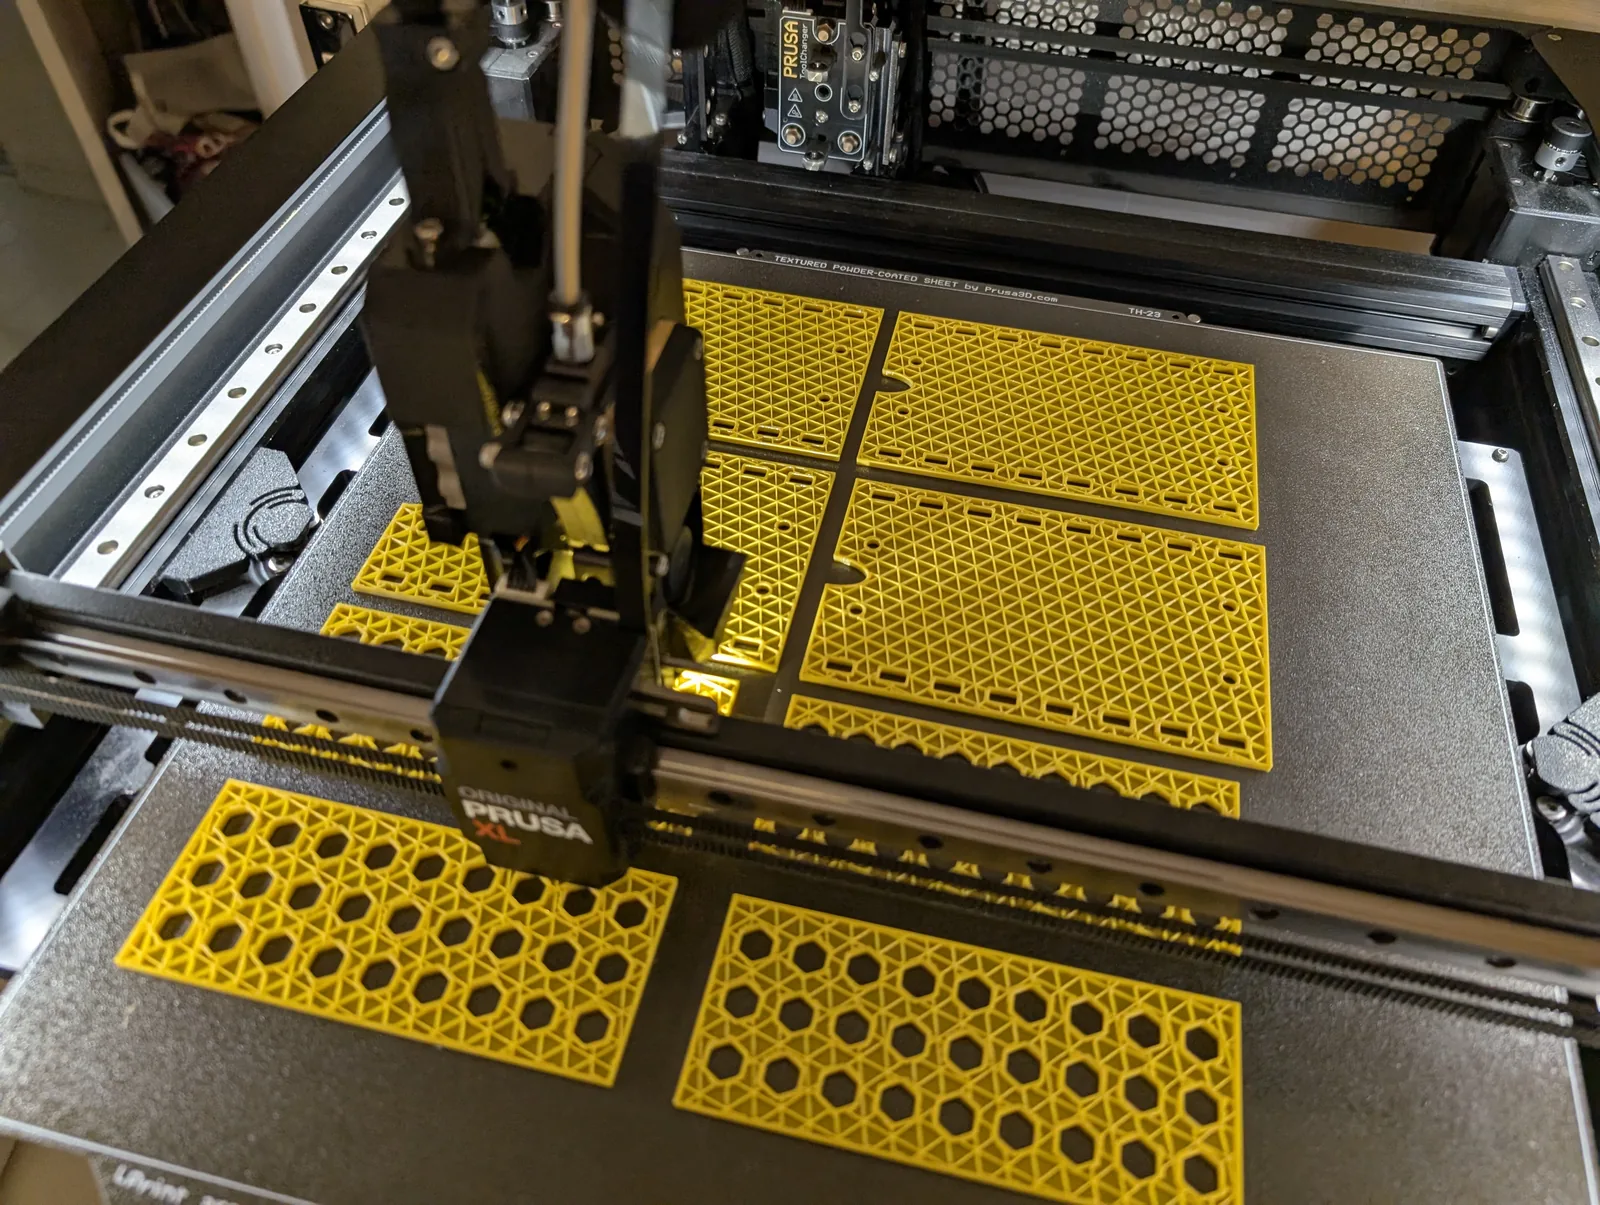
The enclosures were printed on a Prusa XL, whose large build volume made it possible to produce several parts at once.
Wired LAN Sensor
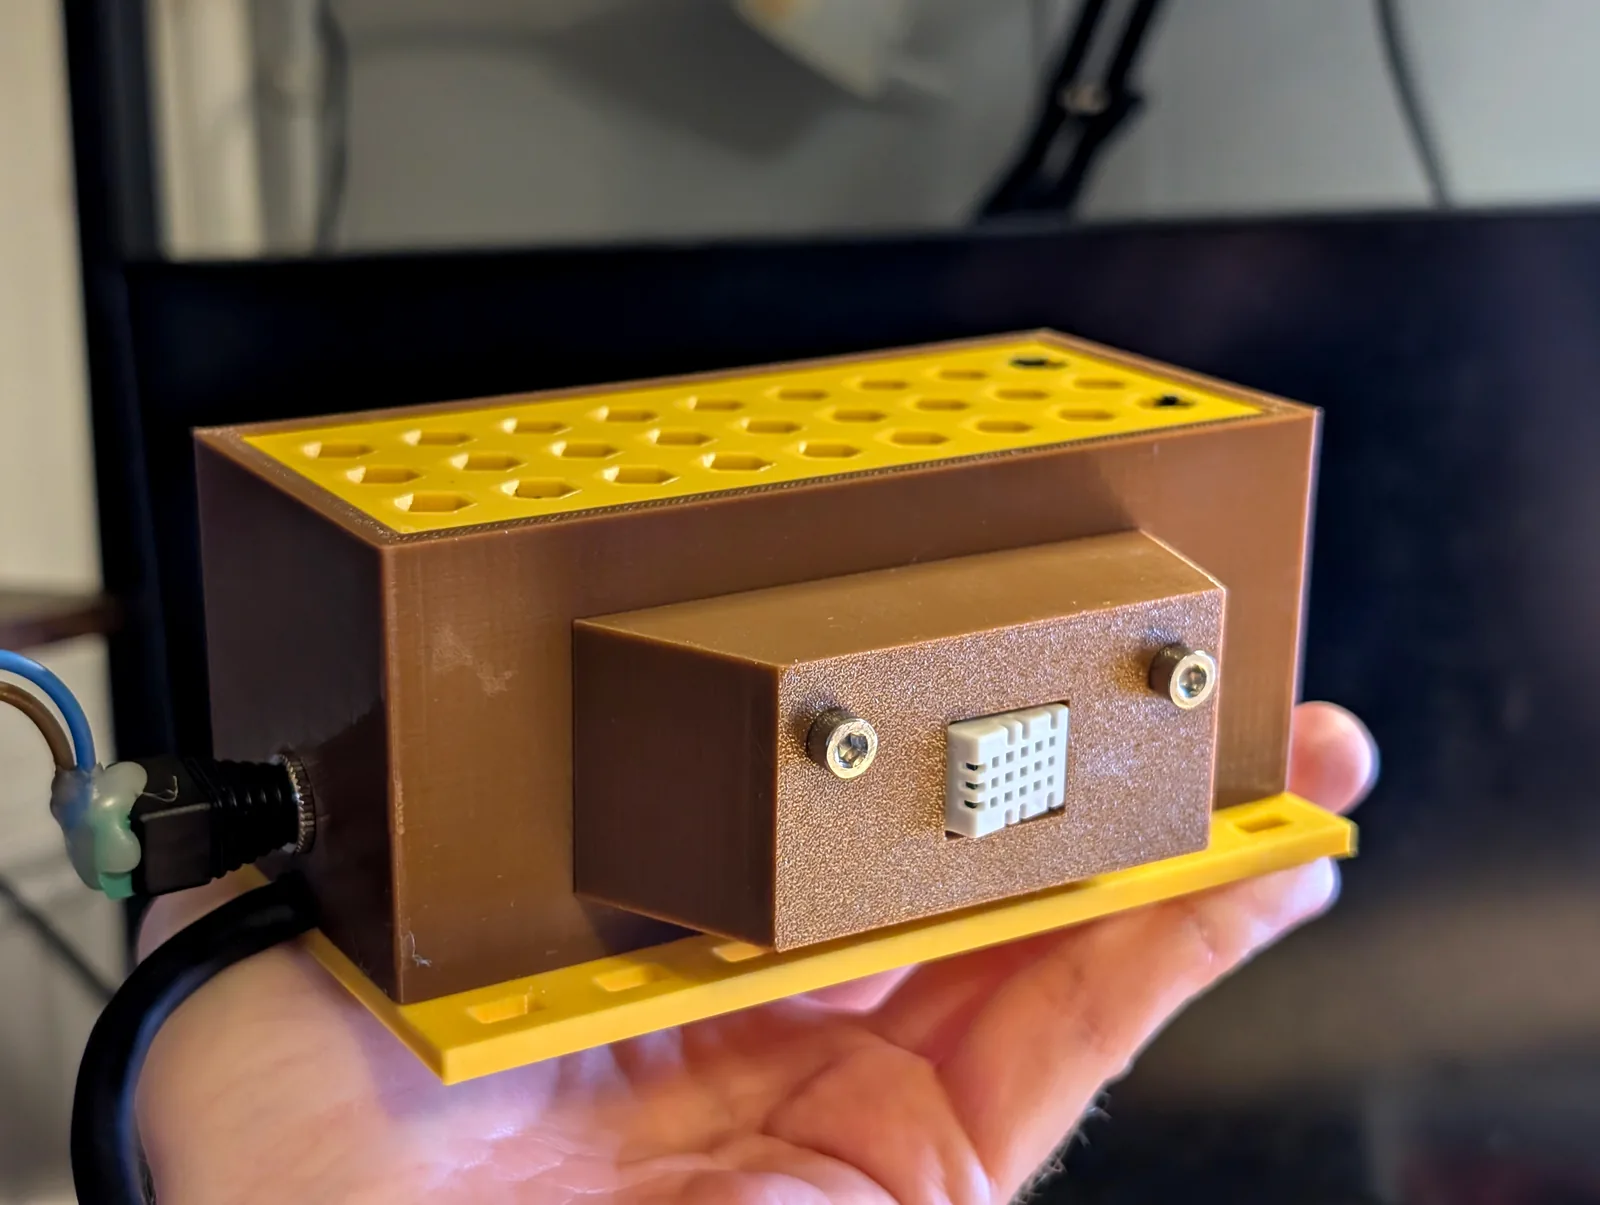
The wired version provides a fixed Ethernet connection. Its enclosure keeps the electronics compact while the sensor remains thermally isolated outside it. It is not powered over Ethernet (PoE); instead, it uses a DC converter and accepts a 5–40 V DC input.
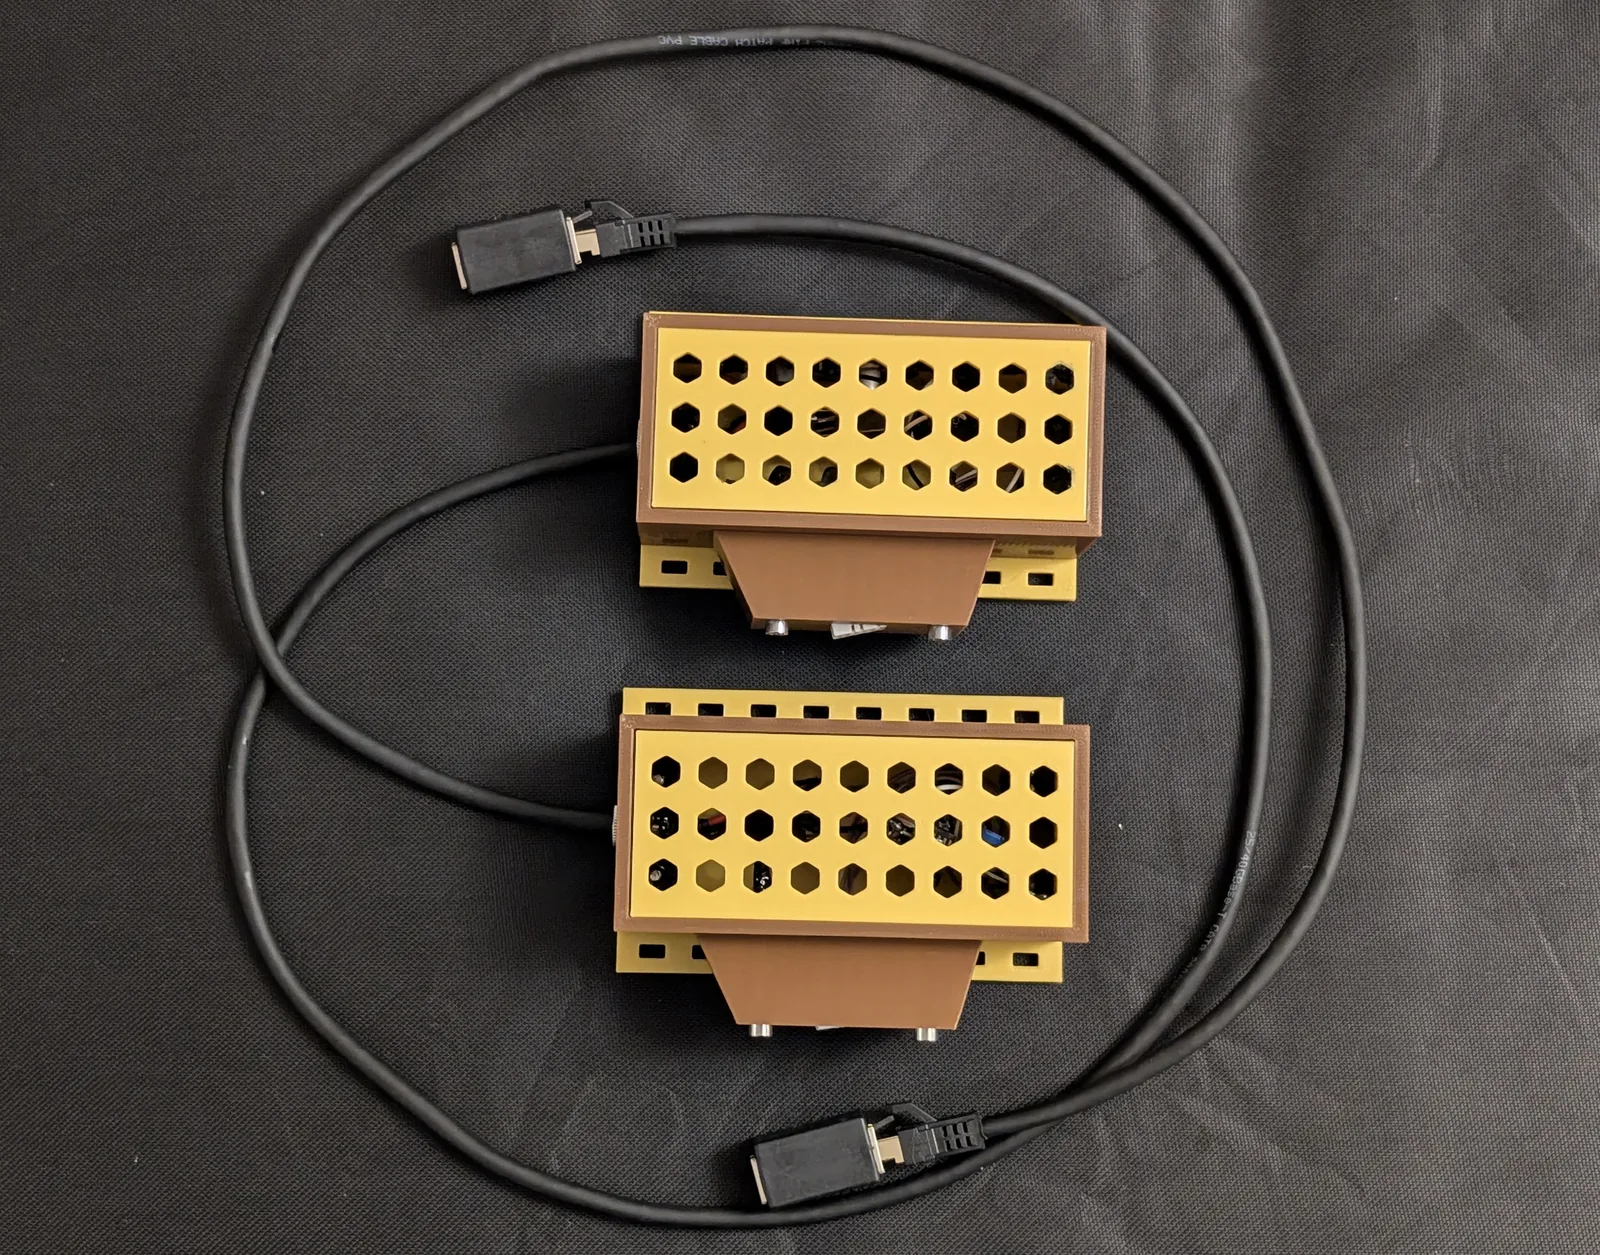
The front opening exposes the sensing area so that air can circulate around it.
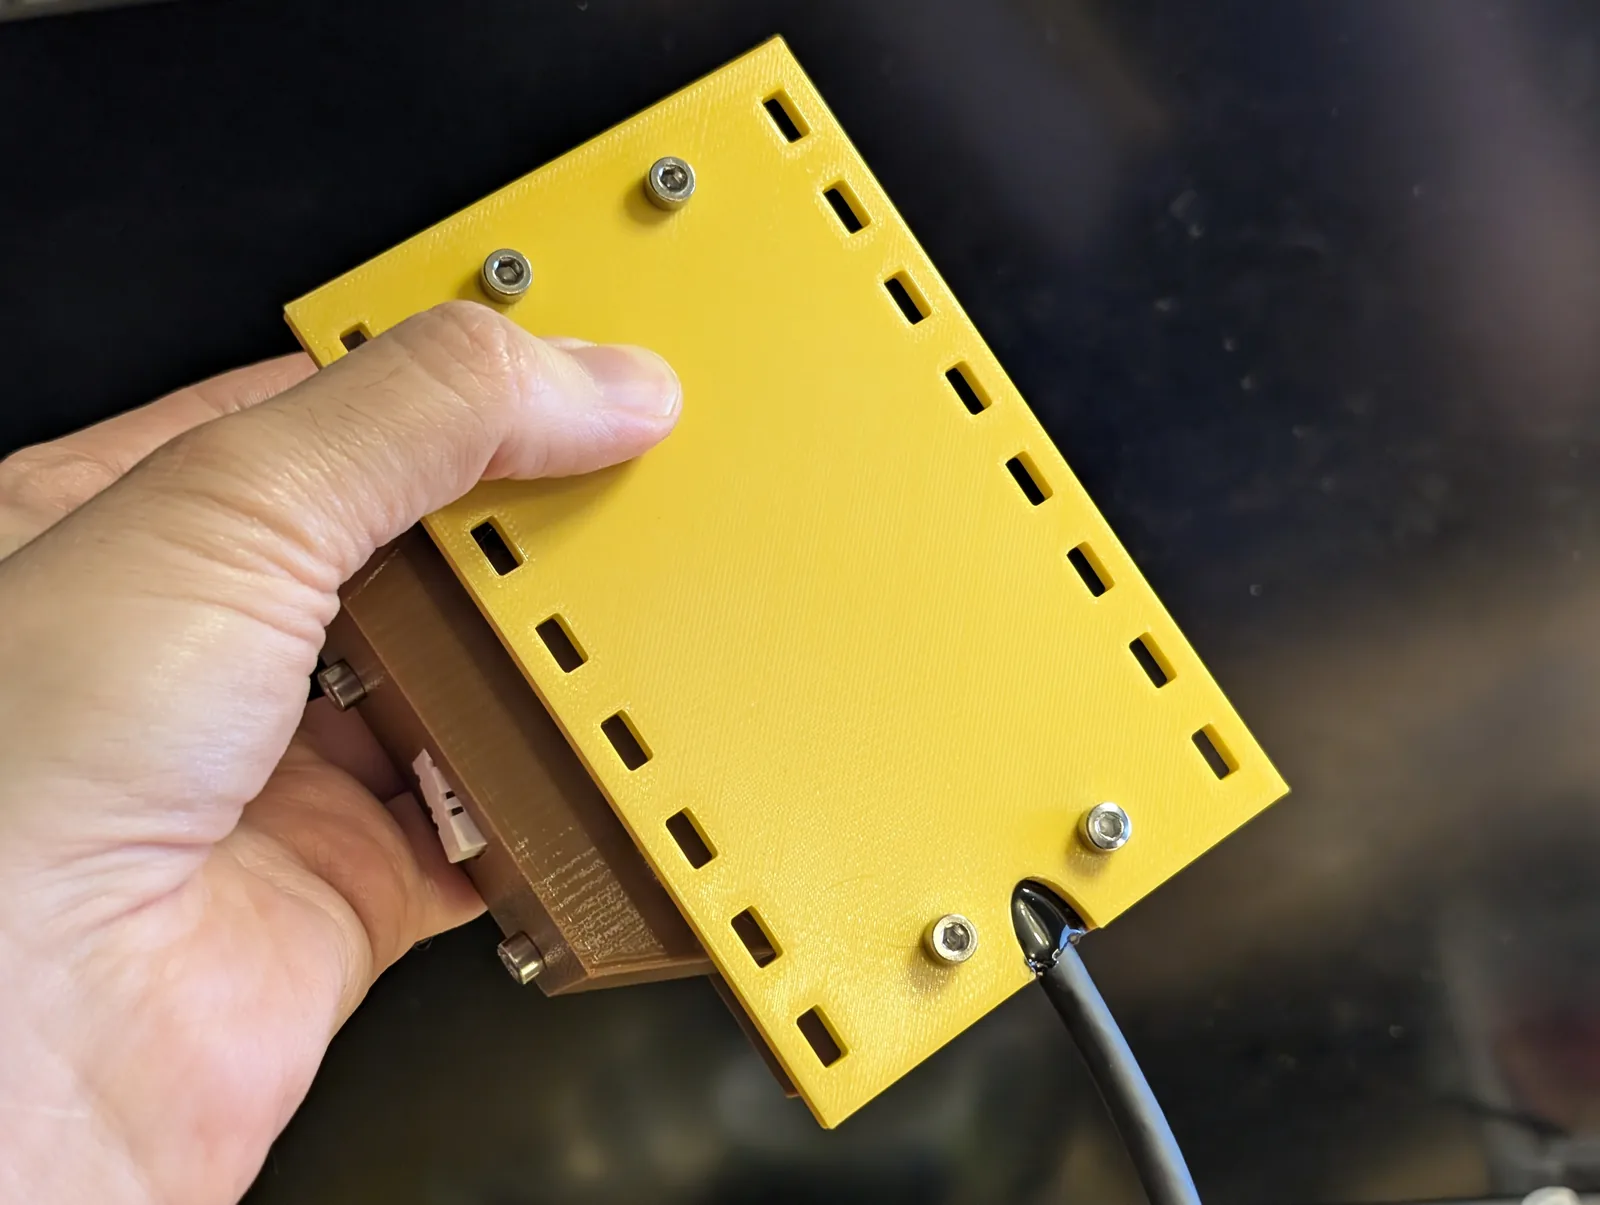
The underside shows how the components and connections are arranged within the enclosure.
Wi-Fi Sensor
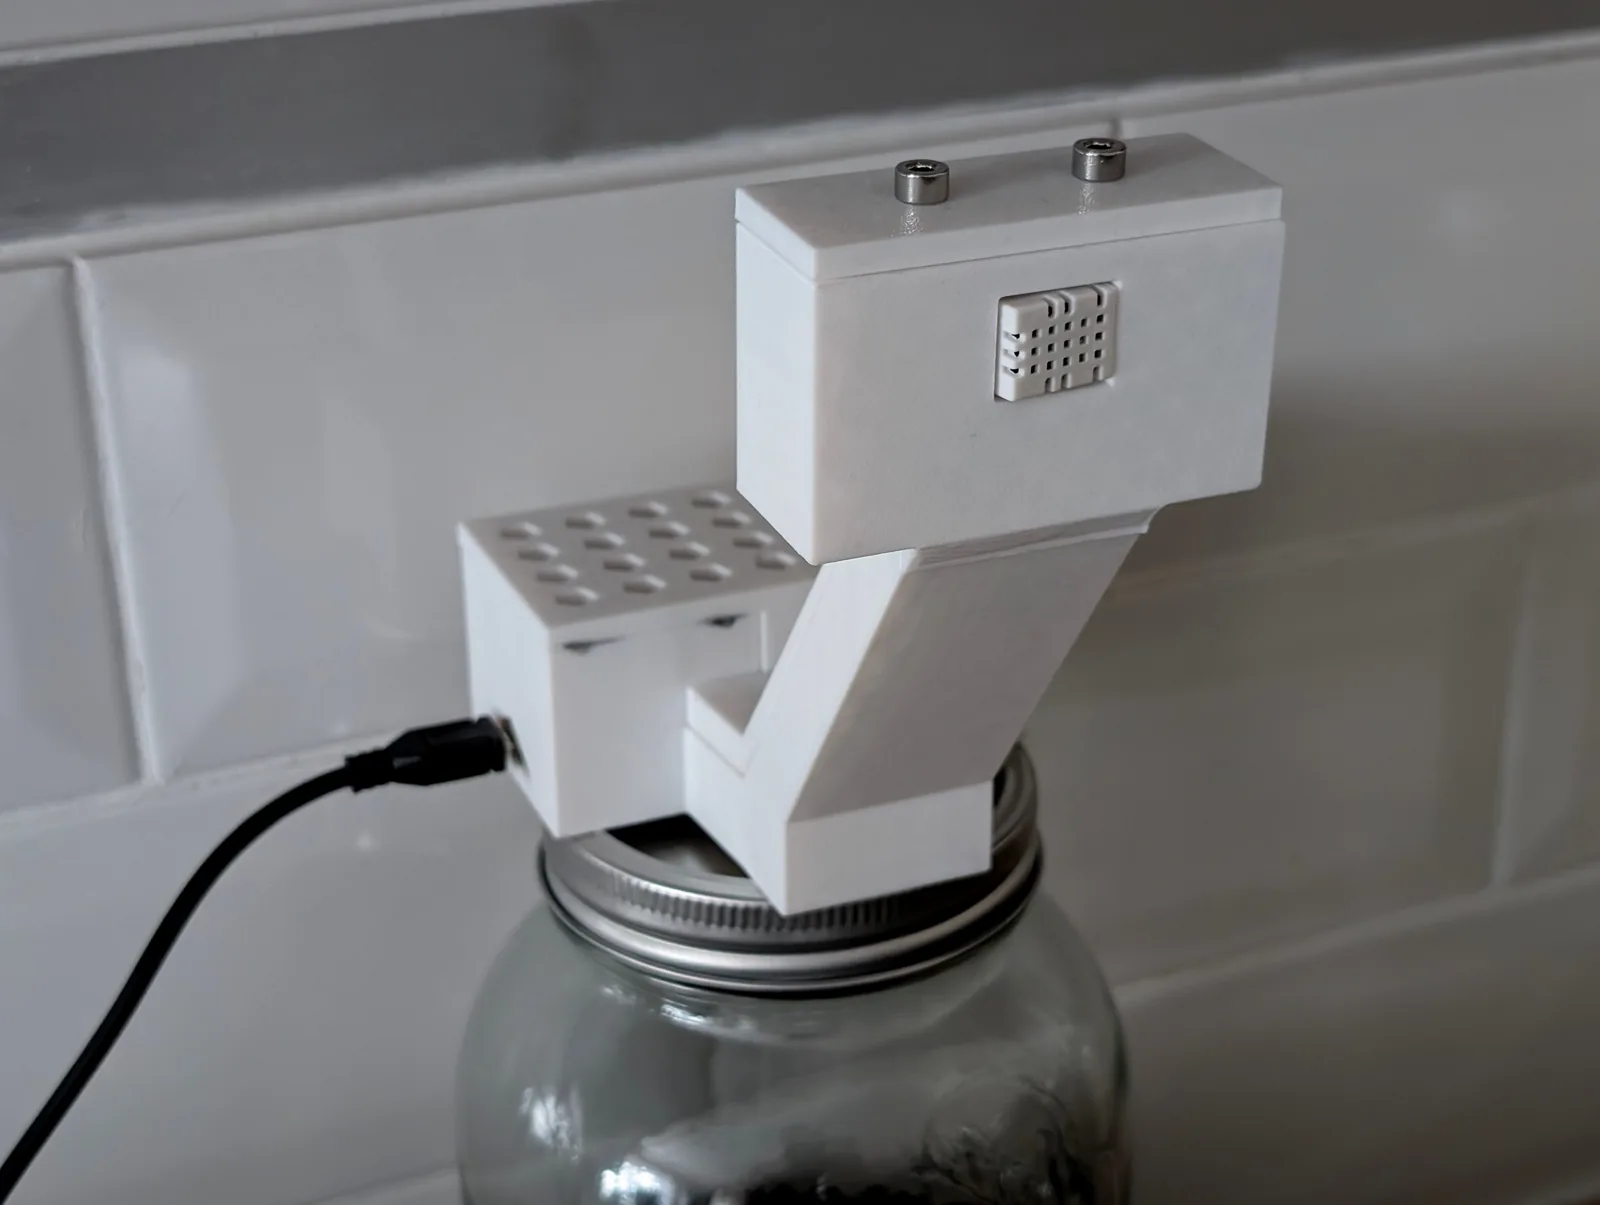
The Wi-Fi version provides the same type of environmental monitoring where a wired connection is not practical. It is powered through a standard USB connector, typically using a USB power adapter.
Monitoring Output
The collected readings are presented as time-based graphs, making temperature and humidity changes easy to review.